How ruby_memcheck Finds Memory Leaks in Native Gems
This is not an article on how to use ruby_memcheck. Refer to the repository for documentation.
This article was adapted as a talk at RubyKaigi 2022.
If you just want to know how ruby_memcheck works without the backstory, you can jump to the
How ruby_memcheck filters for memory leakssection.
On the afternoon of Friday, October 8, 2021, I found a memory leak in a native gem called liquid-c. I wasn’t searching for this memory leak, I just happened to stumble across it. Fixing it was easy enough, but I was sure there were more memory leaks. So I had a choice, I could spend a day or two to debug and find the memory leaks, or I could sink an unknown amount of time to try to make a tool (that may or may or not work) to find it for me. Of course, I chose the latter approach.
So the following week, I spent a week experimenting and prototyping ways to automatically find memory leaks. I had ideas on how to build this tool. I knew I wanted to use Valgrind’s memcheck tool. For background, Valgrind is a collection of error detectors and profilers. One of the tools, memcheck, detects invalid memory usages (e.g. use-after-free, illegal reads/writes, etc.) and memory leaks. It detects memory leaks by tracking all memory allocations and frees, and then at shutdown, it reports all the pieces of memory that have been allocated but not freed.
What is a memory leak and why do I care about it?
A memory leak is a piece of memory that is allocated but never freed, even after the end of its useful lifecycle. In languages that use manual memory management (like C), it’s really easy to forget to release a piece of memory and result in a memory leak. But memory leaks can happen in languages that have automatic memory management too, like Ruby. For example, you could have an in-memory logger that never flushes itself. Then the logger will accumulate more and more log entries causing memory usage to increase.
Memory leaks are a problem because memory is a finite resource. When memory is exhausted, the system’s OOM (out of memory) killer will attempt to kill processes to free up memory. In many cases, this means your Ruby app is killed, which could mean downtime for your users.
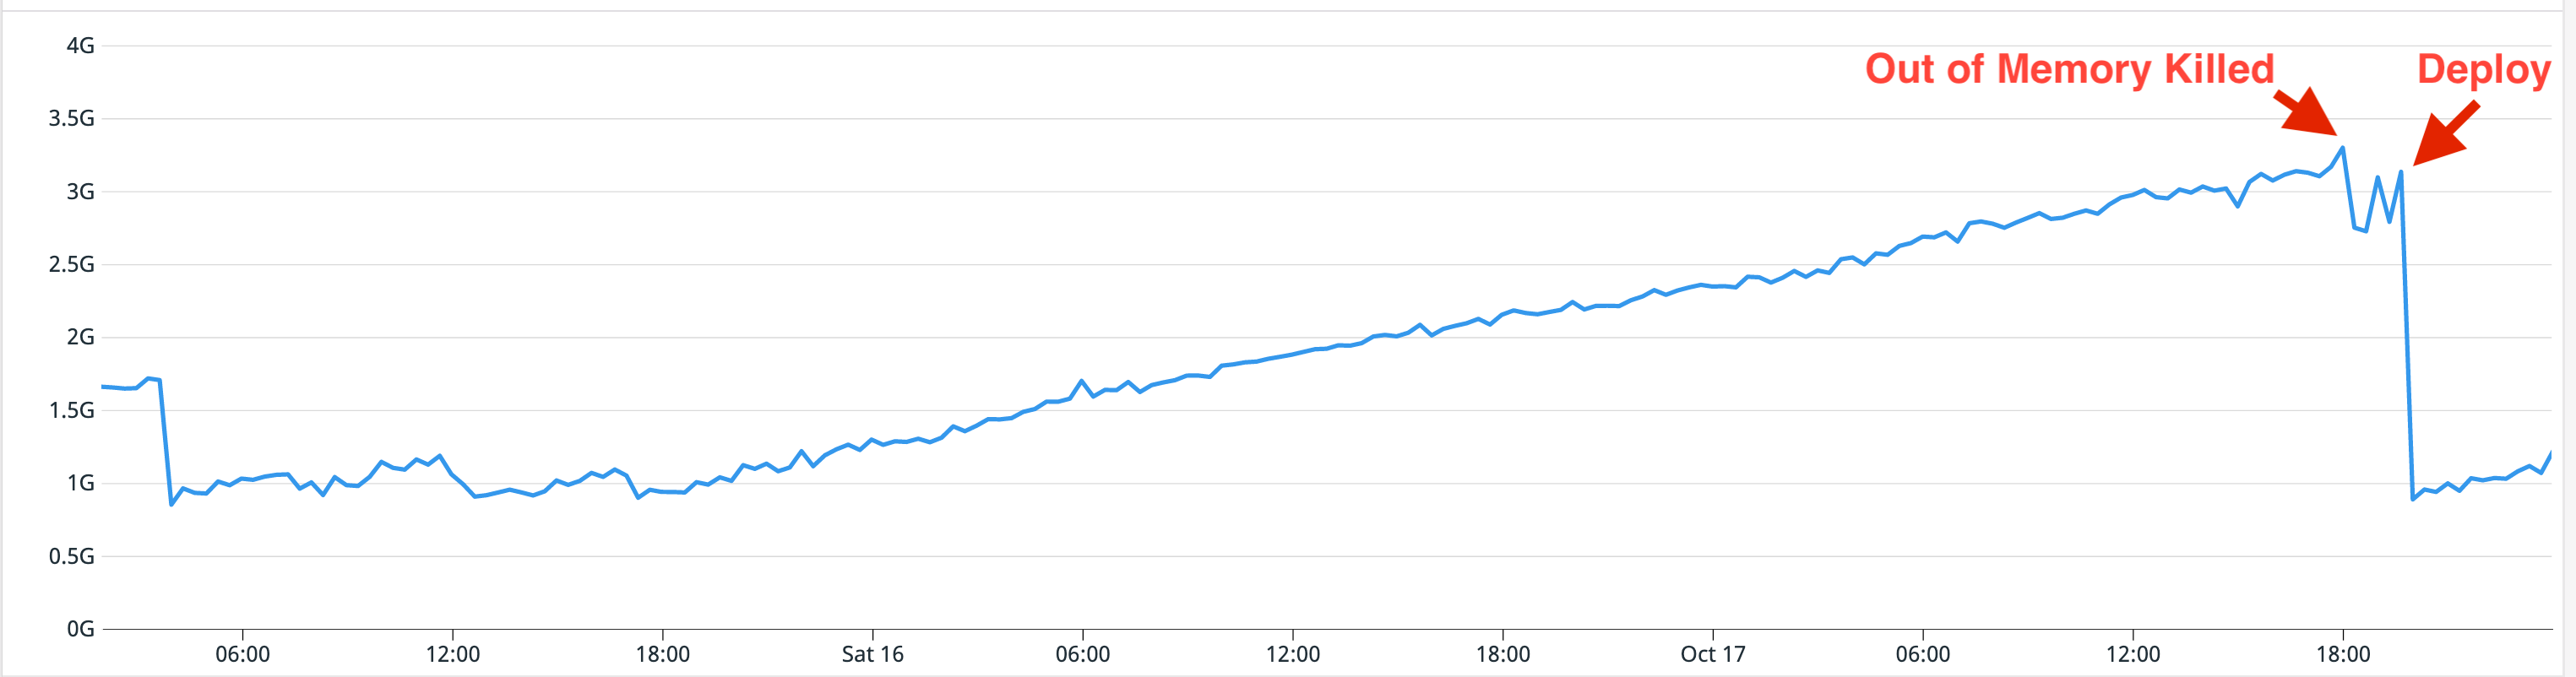
To illustrate the scale of the issue, the graph below shows the maximum memory usage (Resident Set Size) of all web workers of a production service on a weekend. There are no deploys on a weekend so the containers don’t get restarted. You can see that the memory usage grows linearly with time. The graph becomes jagged at the end because containers are starting to run out of memory and the workers are being OOM killed. Eventually, there is a deploy and we see a huge drop in memory usage as all the containers are restarted.
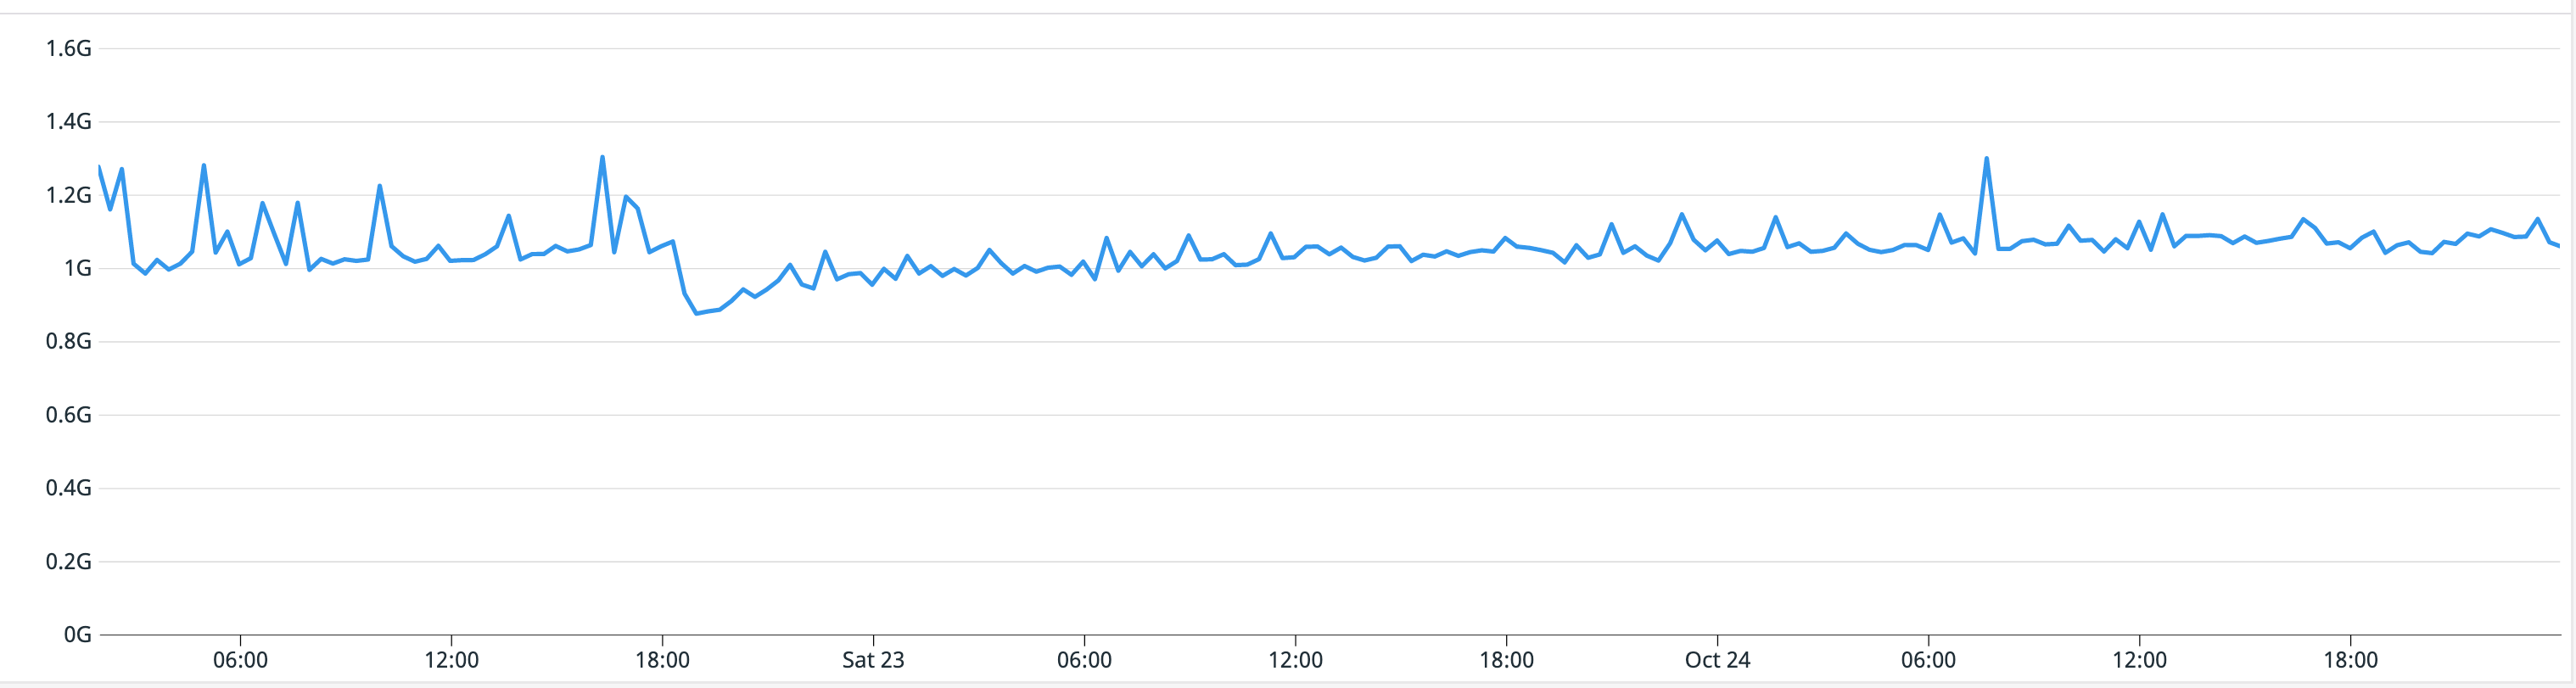
This is the graph of maximum memory usage of the the same service on the following weekend, which includes memory leak fixes that I made. You can see here that throughout the whole weekend, the memory usage stays relatively flat. Before the fix, we peaked at over 3GB of memory usage per worker and got OOM killed, now it’s less than 1.4GB and there are no OOM kills.
Why Valgrind memcheck is unusable on Ruby
Valgrind memcheck is a great tool, but it’s unfortunately unusable on Ruby. The reason is that Ruby does not free all of its resources at shutdown. It does this because when the process exits, the system will reclaim all the memory anyways. This means that freeing all the allocated memory at shutdown is useless work and will only make Ruby’s shutdown slower. However, this means that Valgrind will report a huge amount of memory leaks that are just false positives.
To demonstrate the issue let’s run Valgrind memcheck on a simple Ruby program that does nothing (an empty script). This will show all the memory leaks from Ruby’s startup and shutdown. You can also try this on your own Linux machine.
$ valgrind --num-callers=50 --error-limit=no --undef-value-errors=no \
  --leak-check=full --show-leak-kinds=definite ruby -e ""
...
==28303== 16 bytes in 1 blocks are definitely lost in loss record 1,541 of 11,835
==28303==    at 0x483C855: malloc (vg_replace_malloc.c:381)
==28303==    by 0x15BAA6: objspace_xmalloc0 (gc.c:10618)
==28303==    by 0x15BAA6: ruby_xmalloc0 (gc.c:10839)
==28303==    by 0x15BAA6: ruby_xmalloc_body (gc.c:10848)
==28303==    by 0x15BAA6: ruby_xmalloc (gc.c:12787)
==28303==    by 0x15BAA6: rb_xmalloc_mul_add (gc.c:10937)
==28303==    by 0x3881E7: compile_keyword_arg (compile.c:4063)
...
==28303==
==28303== 25 bytes in 1 blocks are definitely lost in loss record 3,755 of 11,835
==28303==    at 0x483C855: malloc (vg_replace_malloc.c:381)
==28303==    by 0x15FA21: objspace_xmalloc0 (gc.c:10618)
==28303==    by 0x15FA21: ruby_xmalloc2_body (gc.c:10862)
==28303==    by 0x15FA21: ruby_xmalloc2 (gc.c:12797)
==28303==    by 0x29C714: str_new0 (string.c:798)
==28303==    by 0x2A010A: rb_enc_str_new (string.c:847)
...
==28303==
==28303== LEAK SUMMARY:
==28303==    definitely lost: 506,425 bytes in 4,584 blocks
==28303==    indirectly lost: 735,801 bytes in 9,263 blocks
==28303==      possibly lost: 2,182,156 bytes in 7,065 blocks
==28303==    still reachable: 33,759,948 bytes in 822 blocks
==28303==         suppressed: 0 bytes in 0 blocks
==28303== Reachable blocks (those to which a pointer was found) are not shown.
==28303== To see them, rerun with: --leak-check=full --show-leak-kinds=all
==28303==
==28303== For lists of detected and suppressed errors, rerun with: -s
==28303== ERROR SUMMARY: 5866 errors from 5866 contexts (suppressed: 0 from 0)
The output above has been truncated because there are thousands of errors that result in about 70 thousand lines of output. For a real Ruby program, the error output will be much larger. I don’t know about you, but I don’t really want to look through all this output.
But Valgrind is outputting useful information: it’s showing the stack trace of each memory allocation that was leaked. If only we had some way to filter it to only contain useful information…
Filtering Valgrind memcheck’s output
So I started to brainstorm heuristics that could significantly reduce the amount of noise. A heuristic I thought of is to scan the stack trace of each allocation and filter out ones that weren’t allocated by the native gem. This approach would trade false negatives (real memory leaks that get filtered out) for almost no false positives (leaks that we don’t care about). This would have a low false positive rate because, in theory, all memory that a native extension allocates should be the responsibility of that gem to release. But this may result in false negatives. For example, if a piece of memory was allocated in Ruby, passed into the native gem, and then the native gem loses the piece of memory. Another example that it wouldn’t catch would be if Ruby itself has a memory leak.
This sounded like a great plan on paper, so I started building it. But I quickly hit a brick wall. How would I tell if a frame in the stack trace came from Ruby or the native gem? I can get the filename and line number from the stack trace, but how would I know where this file originated from? For example, both Ruby and the liquid-c gem have a vm.c file, so filtering by just by filename is not enough. At this point, I was really out of ideas, and crazy ideas like reading symbols from the Ruby and native extension binaries started to form. Thankfully, I decided to read the Valgrind documentation one last time and found the --xml flag, which really saved me.
Valgrind memcheck’s XML output
Valgrind memcheck supports generating the errors as XML to make it easier to use programmatically. Not only is the format easier to parse, but it also includes much more information! Let’s run Ruby in Valgrind again, but this time outputting XML. We can enable XML output by adding the flags --xml=yes. We’ll also output the XML file to standard output so we add the flag --xml-fd=1 (file descriptor 1 is standard out).
$ valgrind --num-callers=50 --error-limit=no --undef-value-errors=no \
  --leak-check=full --show-leak-kinds=definite --xml=yes --xml-fd=1 ruby -e ""
...

<error>
  <unique>0x607</unique>
  <tid>1</tid>
  <kind>Leak_DefinitelyLost</kind>
  <xwhat>
    <text>16 bytes in 1 blocks are definitely lost in loss record 1,544 of 11,886</text>
    <leakedbytes>16</leakedbytes>
    <leakedblocks>1</leakedblocks>
  </xwhat>
  <stack>
    <frame>
      <ip>0x483C855</ip>
      <obj>/usr/local/libexec/valgrind/vgpreload_memcheck-amd64-linux.so</obj>
      <fn>malloc</fn>
      <dir>/home/peter/src/protobuf/ruby/valgrind-3.18.1/coregrind/m_replacemalloc</dir>
      <file>vg_replace_malloc.c</file>
      <line>381</line>
    </frame>
    <frame>
      <ip>0x15BAA6</ip>
      <obj>/home/peter/.rubies/ruby-3.0.2/bin/ruby</obj>
      <fn>objspace_xmalloc0</fn>
      <dir>/home/peter/src/ruby-3.0.2</dir>
      <file>gc.c</file>
      <line>10618</line>
    </frame>
    <frame>
      <ip>0x15BAA6</ip>
      <obj>/home/peter/.rubies/ruby-3.0.2/bin/ruby</obj>
      <fn>ruby_xmalloc0</fn>
      <dir>/home/peter/src/ruby-3.0.2</dir>
      <file>gc.c</file>
      <line>10839</line>
    </frame>
    <frame>
      <ip>0x15BAA6</ip>
      <obj>/home/peter/.rubies/ruby-3.0.2/bin/ruby</obj>
      <fn>ruby_xmalloc_body</fn>
      <dir>/home/peter/src/ruby-3.0.2</dir>
      <file>gc.c</file>
      <line>10848</line>
    </frame>
    <frame>
      <ip>0x15BAA6</ip>
      <obj>/home/peter/.rubies/ruby-3.0.2/bin/ruby</obj>
      <fn>ruby_xmalloc</fn>
      <dir>/home/peter/src/ruby-3.0.2</dir>
      <file>gc.c</file>
      <line>12787</line>
    </frame>
    <frame>
      <ip>0x15BAA6</ip>
      <obj>/home/peter/.rubies/ruby-3.0.2/bin/ruby</obj>
      <fn>rb_xmalloc_mul_add</fn>
      <dir>/home/peter/src/ruby-3.0.2</dir>
      <file>gc.c</file>
      <line>10937</line>
    </frame>
    <frame>
      <ip>0x3881E7</ip>
      <obj>/home/peter/.rubies/ruby-3.0.2/bin/ruby</obj>
      <fn>compile_keyword_arg</fn>
      <dir>/home/peter/src/ruby-3.0.2</dir>
      <file>compile.c</file>
      <line>4063</line>
    </frame>
...
  </stack>
</error>
...
In the output above I’ve removed some of the Valgrind metadata at the beginning and only included one sample error. Here, each stack frame contains much more information, but most importantly, it includes the binary location in the obj tag! This information will tell us whether the function in the stack frame belongs to Ruby, the native gem, or some other binary.
Memory leak in liquid-c
At this point, I was really excited. I had all the pieces I needed to make this work. I could see the light at the end of the tunnel! So I ran Valgrind on liquid-c to see if I could manually find the memory leak that I had already found. And indeed, I found the memory leak reported in the output!
...
<error>
  <unique>0x6755</unique>
  <tid>1</tid>
  <kind>Leak_DefinitelyLost</kind>
  <xwhat>
    <text>400 bytes in 5 blocks are definitely lost in loss record 26,454 of 29,530</text>
    <leakedbytes>400</leakedbytes>
    <leakedblocks>5</leakedblocks>
  </xwhat>
  <stack>
    <frame>
      <ip>0x484147B</ip>
      <obj>/usr/local/libexec/valgrind/vgpreload_memcheck-amd64-linux.so</obj>
      <fn>calloc</fn>
      <dir>/home/peter/src/protobuf/ruby/valgrind-3.18.1/coregrind/m_replacemalloc</dir>
      <file>vg_replace_malloc.c</file>
      <line>1328</line>
    </frame>
...
    <frame>
      <ip>0x15DFB0</ip>
      <obj>/home/peter/.rubies/ruby-3.0.2/bin/ruby</obj>
      <fn>rb_data_typed_object_zalloc</fn>
      <dir>/home/peter/src/ruby-3.0.2</dir>
      <file>gc.c</file>
      <line>2519</line>
    </frame>
    <frame>
      <ip>0xC03CC40</ip>
      <obj>/home/peter/src/liquid-c/lib/liquid_c.so</obj>
      <fn>expression_new</fn>
      <dir>/home/peter/src/liquid-c/tmp/x86_64-linux/liquid_c/3.0.2/../../../../ext/liquid_c</dir>
      <file>expression.c</file>
      <line>37</line>
    </frame>
    <frame>
      <ip>0xC0426AF</ip>
      <obj>/home/peter/src/liquid-c/lib/liquid_c.so</obj>
      <fn>try_variable_strict_parse</fn>
      <dir>/home/peter/src/liquid-c/tmp/x86_64-linux/liquid_c/3.0.2/../../../../ext/liquid_c</dir>
      <file>variable.c</file>
      <line>53</line>
    </frame>
    <frame>
      <ip>0x13A91D</ip>
      <obj>/home/peter/.rubies/ruby-3.0.2/bin/ruby</obj>
      <fn>rb_vrescue2</fn>
      <dir>/home/peter/src/ruby-3.0.2</dir>
      <file>eval.c</file>
      <line>1019</line>
    </frame>
    <frame>
      <ip>0x13AB9D</ip>
      <obj>/home/peter/.rubies/ruby-3.0.2/bin/ruby</obj>
      <fn>rb_rescue2</fn>
      <dir>/home/peter/src/ruby-3.0.2</dir>
      <file>eval.c</file>
      <line>996</line>
    </frame>
...
  </stack>
</error>
So then I quickly build a scrappy initial implementation of the gem ruby_memcheck. Using it, I was able to find the other liquid-c memory leak very easily with no false positives 🎉. I was very impressed by how well this tool worked, so I started working on a better implementation that could be open-sourced and shared with the community.
How ruby_memcheck filters for memory leaks
Now that you’ve seen how Valgrind memcheck works and the kind of output it emits, let’s talk about how the core heuristics work for ruby_memcheck.
ruby_memcheck starts by wrapping the Rake tasks for minitest or RSpec and overriding the Ruby command it runs to run Ruby with Valgrind. After Ruby and Valgrind completes, it parses the XML files generated and reads each error one by one. For each error, it first looks at the type of the error (e.g. memory leak, use-after-free, invalid read/write, etc.) and applies different heuristics. We only really care about memory leaks since we perform little to no filtering on the other types.
There are several possible cases we have to consider to determine whether an allocation stack is a false positive or a memory leak we want to report.
- If the stack trace does not contain stack frames that originate from the native gem, then it should be rejected as a false positive. This should remove most of the false positives coming from Ruby itself.
- If the native gem calls back into Ruby (such as
rb_funcallto call a Ruby method, orrb_raiseto raise an error), then it should be rejected as a false positive. The ruby_memcheck gem maintains a list of functions that cause the native gem to call back into Ruby. - Leaks in the
Initfunction of the native extension should be rejected as a false positive. TheInitfunction is only ever run once (the first time the gem is required), so it cannot cause memory to bloat.
For memory leaks, we scan the stack from the top (closest point to the memory allocation) to the bottom (furthest point from the memory allocation) and we apply the heuristics above. The logic above is implemented in the method RubyMemcheck::Stack#skip?, which returns true if the stack should be skipped, and false otherwise. The logic is fairly simple and well documented, so I encourage you to read the code!
Limitations
The heuristics above trades a low false positive rate for possible false negatives. So there are limitations to the kinds of memory leaks it’s able to find.
The biggest limitation is that it will not find memory leaks of allocations that occurred in Ruby, even if the memory leak is caused by the native extension. An example of this is if a string is allocated in Ruby, passed into the native extension, it changes the pointer of the string without freeing the contents, so the contents of the string are leaked.
You can find a list of all limitations in the Limitations section of the README.
Does this even work?
Yes! And surprisingly well! At the time of writing, this tool has found a total of 10 memory leaks, including popular gems such as nokogiri, liquid-c, and protobuf. You can find success stores in the README. Please share yours too when you get it working on your native gem!
Request for the Ruby community
If you are a maintainer of a Ruby gem with native extensions, please try this gem out. I’d be happy to connect with you and pair on this! Feel free to reach out through Twitter (@peterzhu2118) or email (peter [at] peterzhu.ca). Together, let’s make Ruby a more efficient and stable platform for everyone!